X射线成像系统噪声可分为三种类型:本底噪声、随机噪声和孤立噪声。
分别采用均值滤波、中值滤波、自适应中值滤波和高斯滤波对图像进行去噪处理。均值滤波中 常用正方形滤波模板一般有3×3、5×5和7×7,使用均值滤波会将煤矸的成像边界变得模糊,原因是邻域内所有像素点在均值中所占的权值都是1/9,采用均值滤波可有效去除图像中的高频噪声。中值滤波相对均值滤波能够保留图像的边缘细节,对某些随机噪声具有非常理想的降噪能力,并且可以有效的去处成像时的坏点。高斯滤波相对均值滤波对图像的模糊程度更小,能够保留整体细节。自适应中值滤波基于传统中值滤波改进,可去除强度较高的椒盐噪声,对如高斯噪声也有一定的抑制效果,同时保证图像边缘细节。
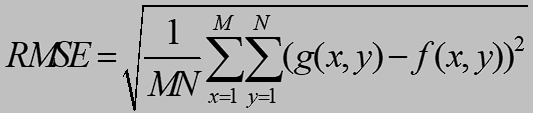
对图像进行去噪后,通常采用均方根误差RMSE(Root Mean Square Error)和峰值信噪比PSNR(Peak Signal to Noise Ratio)进行评价。RMSE值越小表明滤波后的图像与真实图像偏差越小,滤波效果越好。PSNR值越大,表明滤波后的图像与真实图像越相似,失真度低。其RMSE和PSNR计算公式如下:
式中:MAX 表示图像灰度值的最大值,取255,M 、N 表示图像大小。
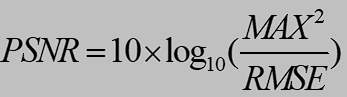
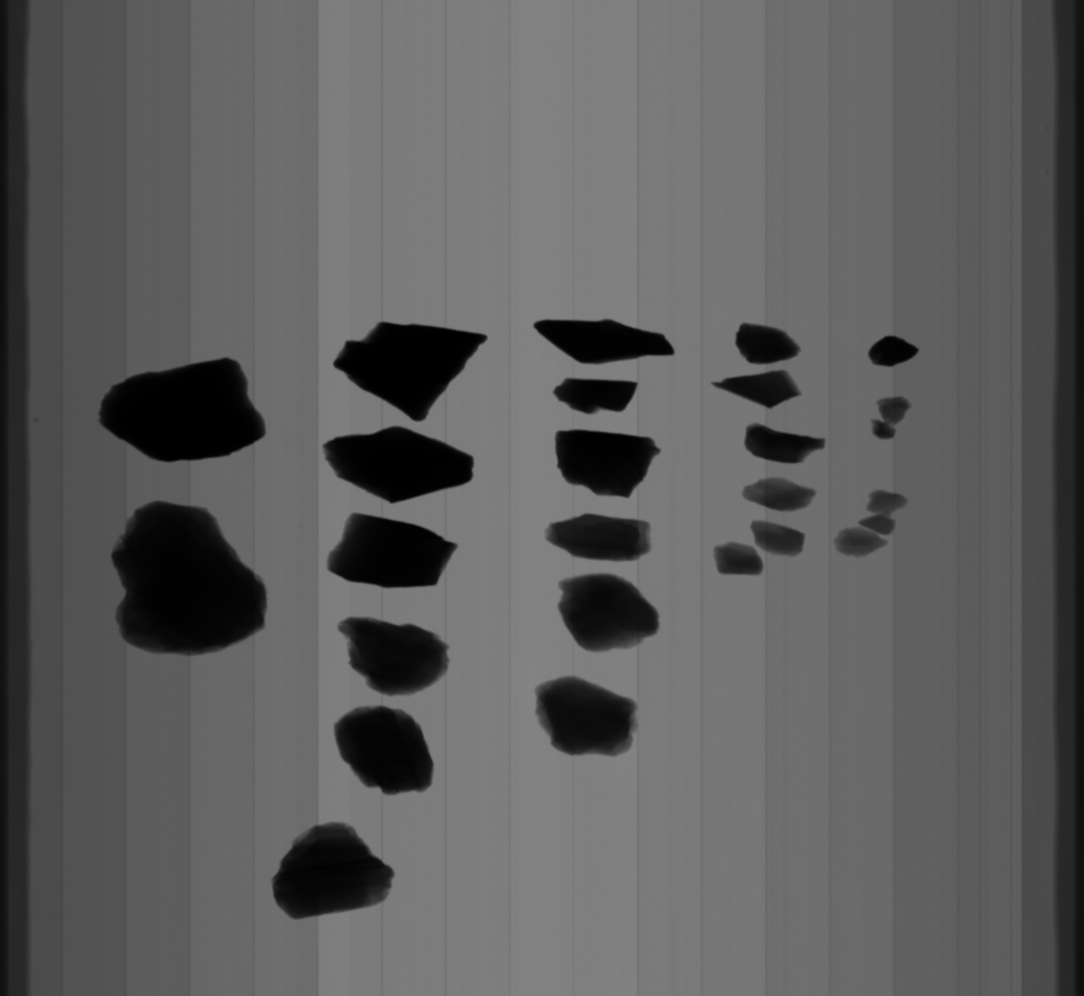
待处理的图像由两张,分别是有物料图像和无物料的背景图像:
处理结果如下:
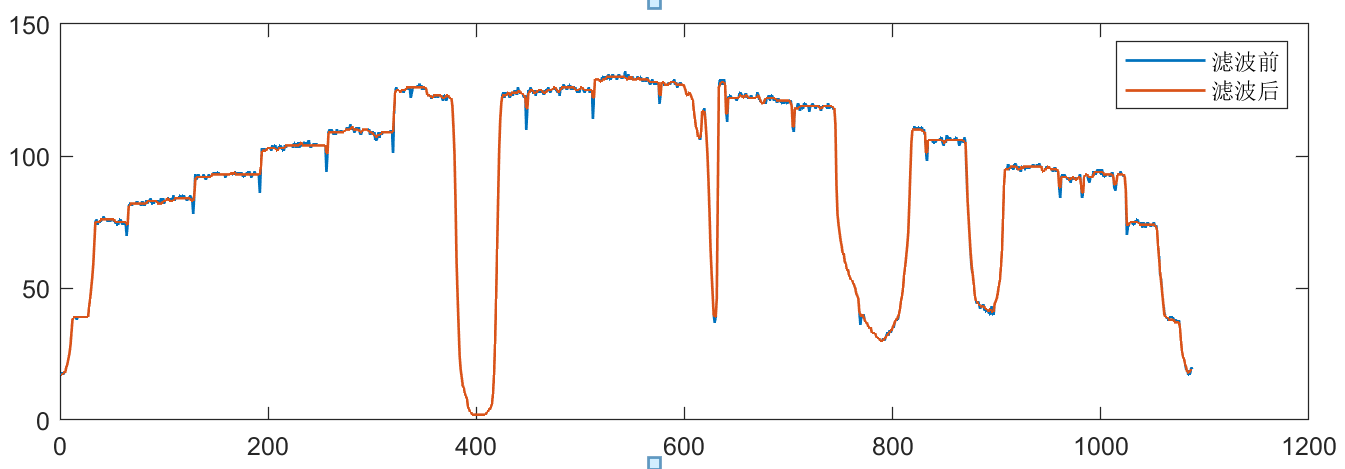
均值滤波 1 2 3 4 5 6 7 8 9 10 11 12 13 14 15 16 17 18 19 20 21 22 23 24 25 26 27 28 29 30 31 32 33 clc clear all; close all; High = imread('C:\Users\雷子\Desktop\桌面文件\图像校正复原\2020_8_20_9_23_28_703_L.bmp' ); figure ,imshow(High);J=High; K1=filter2(fspecial('average' ,3 ),J); K2=filter2(fspecial('average' ,5 ),J); K3=filter2(fspecial('average' ,7 ),J); figure ,imshow(K1,[]);title('3×3模板均值滤波' ); figure ,imshow(K2,[]);title('5×5模板均值滤波' ); figure ,imshow(K3,[]);title('7×7模板均值滤波' ); K4 = double(High); plot (K4(500 ,:)), hold on;plot (K1(500 ,:)), hold on;plot (K2(500 ,:)), hold on;plot (K3(500 ,:)), hold on;for i = 1 :1000 for j = 1 :1088 S(i ,j ) =double((K1(i ,j )-double(High(i ,j )))^2 ); end end RSME =( (sum(sum(S))/(1000 *1088 )))^(1 /2 ); PSNR = 10 *log10 (255 ^2 /RSME);
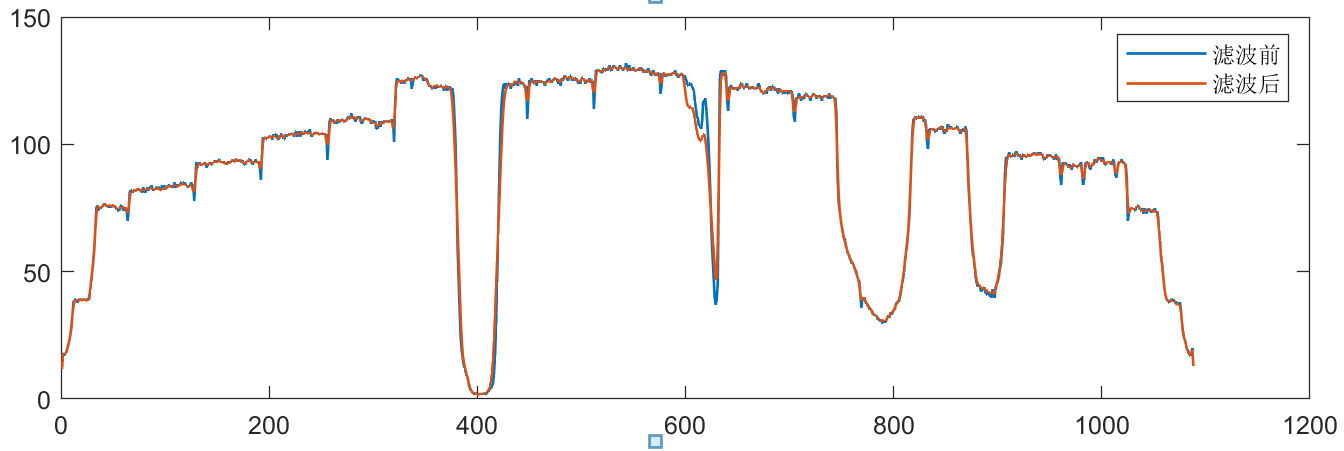
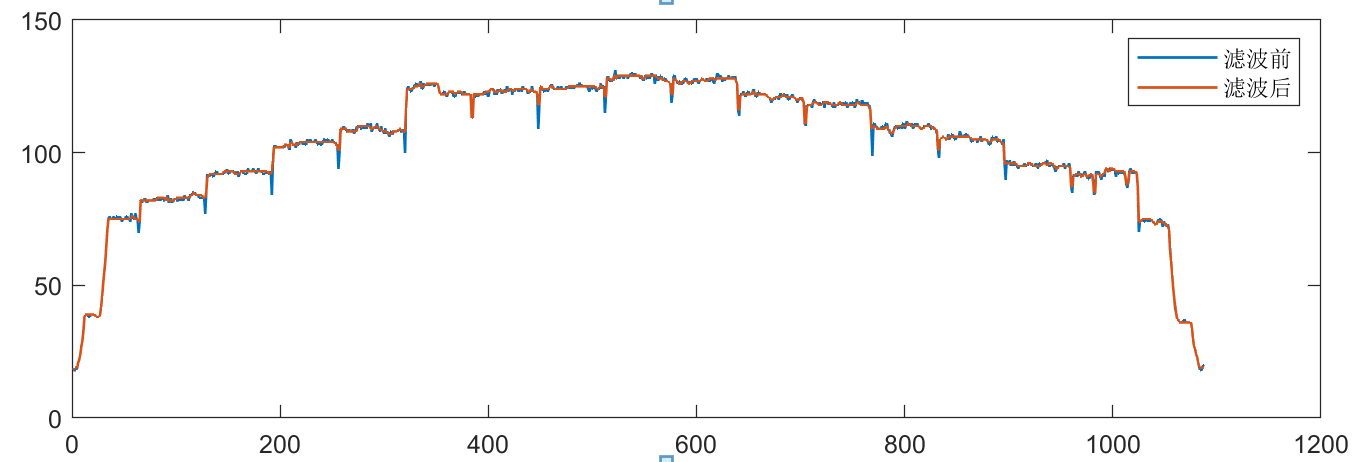
均值滤波中3×3模版最好,有物料图像,滤波后像素数值变化如下:
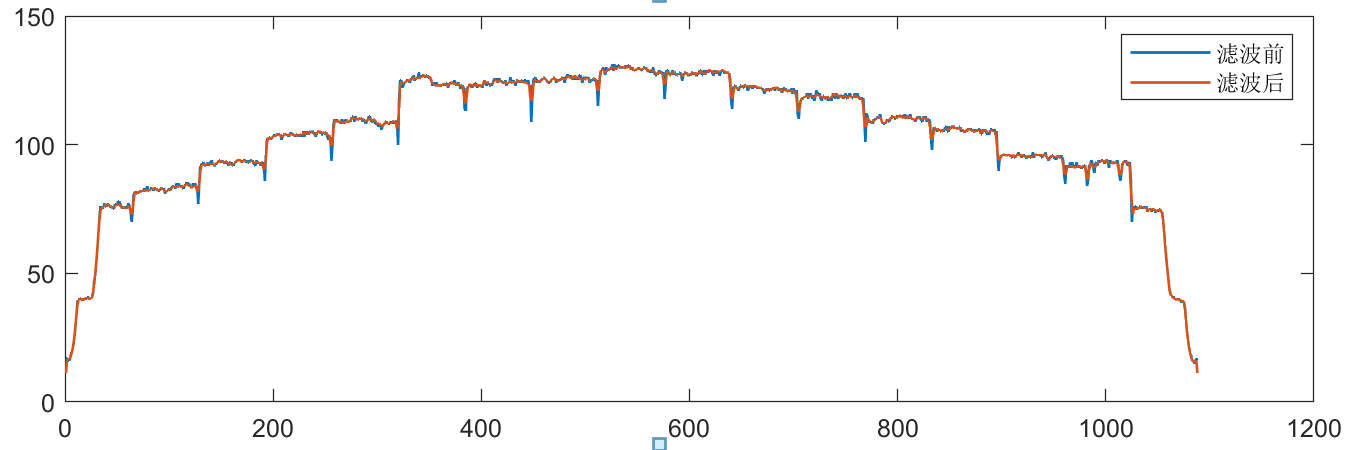
无物料图像,滤波后像素数值变化如下:
中值滤波 1 2 3 4 5 6 7 8 9 10 11 12 13 14 15 16 17 18 19 20 21 22 23 24 25 26 27 28 29 30 31 32 33 34 35 36 clc clear all; close all; High = imread('C:\Users\雷子\Desktop\桌面文件\图像校正复原\2020_8_20_9_23_30_357_L.bmp' ); figure ,imshow(High);J=High; K5=medfilt2(J,[3 3 ]); K6=medfilt2(J,[5 5 ]); K7=medfilt2(J,[7 7 ]); subplot(2 ,2 ,2 ); imshow(K5); title('3×3模板中值滤波' ); subplot(2 ,2 ,3 ); imshow(K6); title('5×5模板中值滤波' ); subplot(2 ,2 ,4 ); imshow(K7); title('7×7模板中值滤波' ); plot (High(500 ,:)), hold on;plot (K5(500 ,:)), hold on;plot (K6(500 ,:)), hold on;plot (K7(500 ,:)), hold on;for i = 1 :1000 for j = 1 :1088 S(i ,j ) =double((K5(i ,j )-double(High(i ,j )))^2 ); end end RSME =( (sum(sum(S))/(1000 *1088 )))^(1 /2 ); PSNR = 10 *log10 (255 ^2 /RSME);
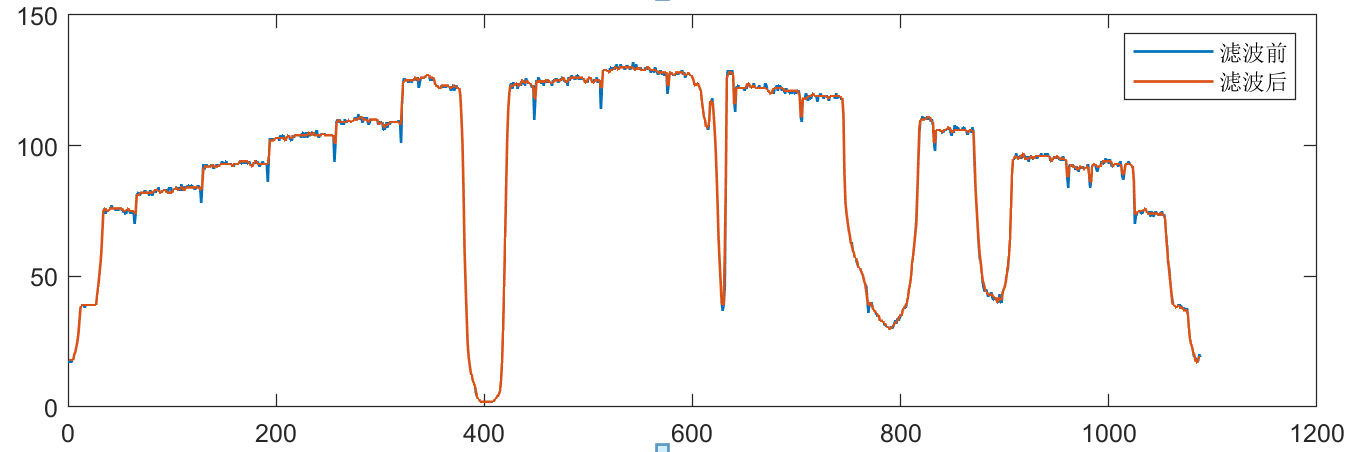
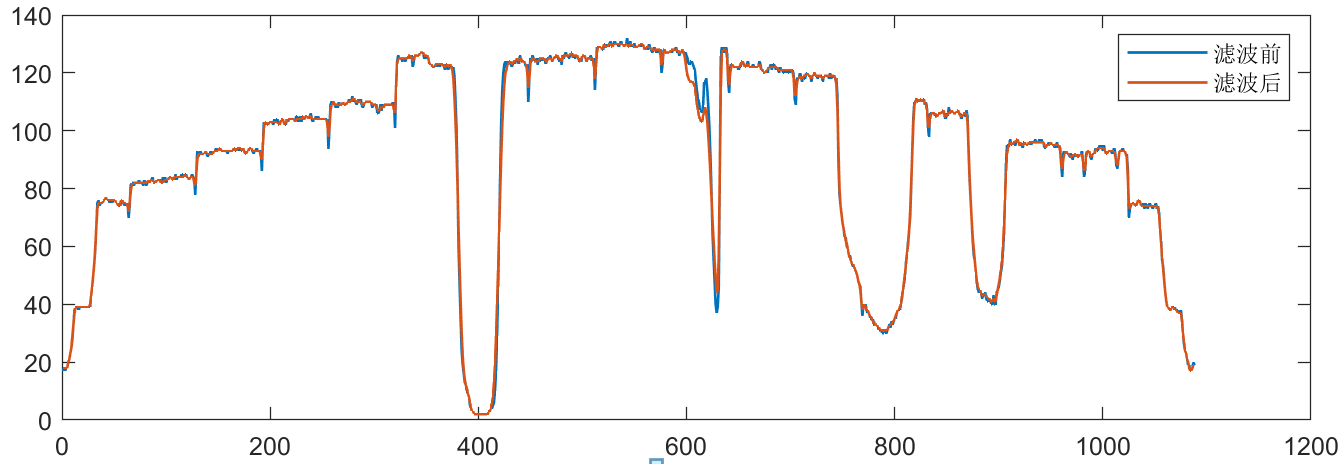
中值滤波中3×3模版最好,有物料图像,滤波后像素数值变化如下:
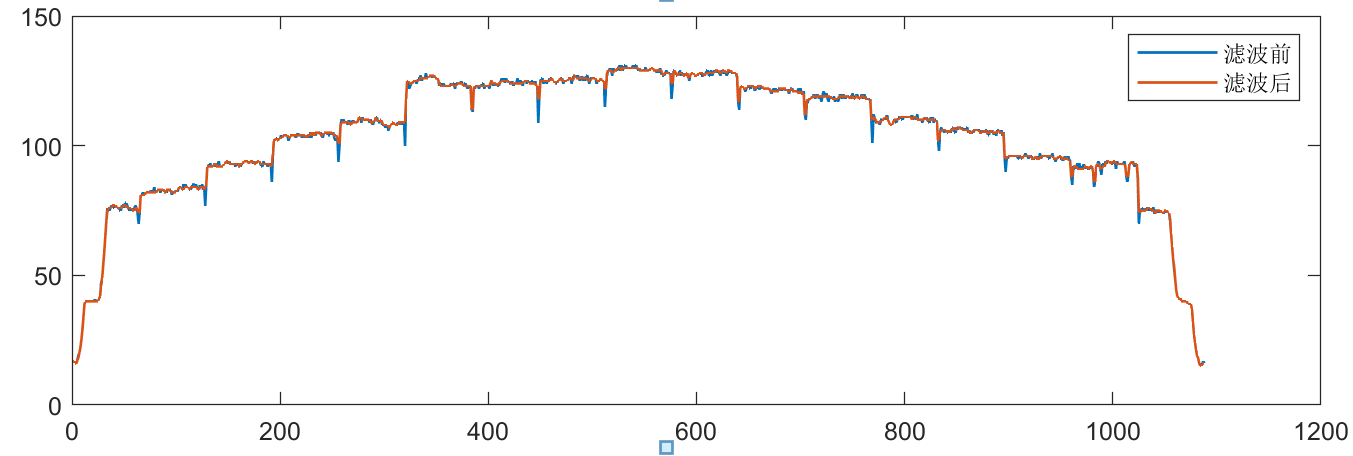
无物料图像,滤波后像素数值变化如下:
自适应中值滤波: 1 2 3 4 5 6 7 8 9 10 11 12 13 14 15 16 17 18 19 20 21 22 23 24 25 26 27 28 29 30 31 32 33 34 35 36 37 38 39 40 41 42 43 clc clear all; close all; High = imread('C:\Users\雷子\Desktop\桌面文件\图像校正复原\2020_8_20_9_23_28_703_L.bmp' ); figure ,imshow(High);I_noise = High; [Im,In]=size (I_noise); nmin = 3 ; nmax = 7 ; I_out = I_noise; I_ex = [zeros ((nmax-1 )/2 ,In+(nmax-1 ));zeros (Im,(nmax-1 )/2 ),I_noise,zeros (Im,(nmax-1 )/2 );zeros ((nmax-1 )/2 ,In+(nmax-1 ))]; for x =1 :Im for y = 1 :In for n = nmin:2 :nmax Sxy = I_ex(x+(nmax-1 )/2 -(n-1 )/2 :x+(nmax-1 )/2 +(n-1 )/2 ,y+(nmax-1 )/2 -(n-1 )/2 :y+(nmax-1 )/2 +(n-1 )/2 ); Smin = min (min (Sxy)); Smax = max (max (Sxy)); Smed = median(median(Sxy)); if Smed > Smin && Smed < Smax if I_out(x,y) <= Smin || I_out(x,y) >= Smax I_out(x,y) = Smed; end break end end I_out(x,y) = Smed; end end figure ,imshow(I_out);plot (High(500 ,:)), hold on;plot (I_out(500 ,:)), hold on;for i = 1 :1000 for j = 1 :1088 S(i ,j ) =double((I_out(i ,j )-double(High(i ,j )))^2 ); end end RSME =( (sum(sum(S))/(1000 *1088 )))^(1 /2 ); PSNR = 10 *log10 (255 ^2 /RSME);
有物料图像,滤波后像素数值变化如下:
无物料图像,滤波后像素数值变化如下:
高斯滤波 1 2 3 4 5 6 7 8 9 10 11 12 13 14 15 16 17 18 19 20 21 22 clc clear all; close all; High = imread('C:\Users\雷子\Desktop\桌面文件\图像校正复原\2020_8_20_9_23_26_941_L.bmp' ); figure ,imshow(High);W = fspecial('gaussian' ,[3 ,3 ],0.8 ); K8= imfilter(High, W, 'replicate' ); plot (High(500 ,:)), hold on;plot (K8(500 ,:)), hold on;subplot(121 ),imshow(High); subplot(122 ),imshow(K8); for i = 1 :1000 for j = 1 :1088 S(i ,j ) =double((k8(i ,j )-double(High(i ,j )))^2 ); end end RSME =( (sum(sum(S))/(1000 *1088 )))^(1 /2 ); PSNR = 10 *log10 (255 ^2 /RSME);
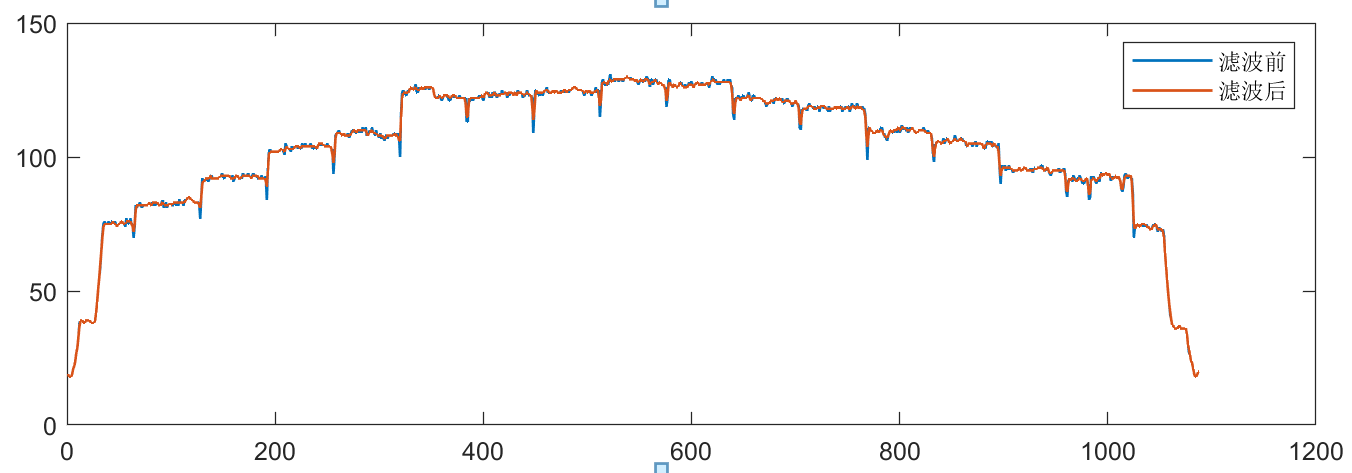
高斯滤波中3×3模版,标准差0.8滤波效果最好,有物料图像,滤波后像素数值变化如下:
无物料图像,滤波后像素数值变化如下:
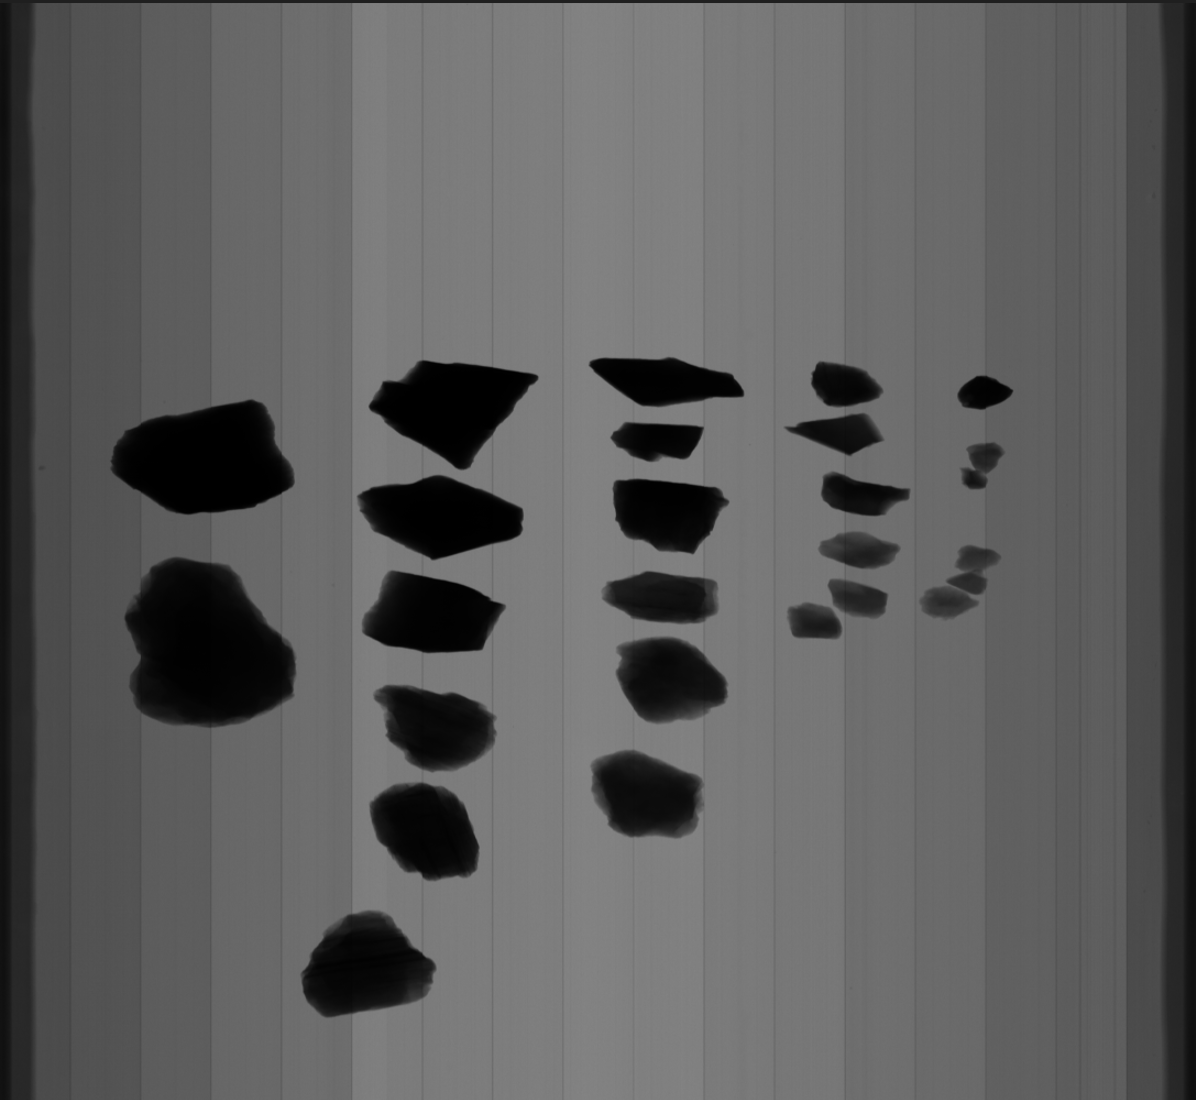
由表可知,高斯滤波的整体效果更好,当模板大小为3×3,方差为0.8时,RMSE和PSNR值均优于其他方法。
高斯滤波后的图像:
对原图像采用高斯滤波并不会提高图像的均匀度,也即不会对产生的条纹缺陷起到削弱作用。如何提高图像的均匀度将在下一份文档中具体介绍。